What do constellations look like from other angles?
I made a little interactive astronomy demonstration to find out!
I made this using public data, and code for which is available on Github. Check it out if you want! This article is about the why-and-how of that project.
Background
Biron said absently, "You know why they call it the Horsehead Nebula, Gil?"
"The first man to enter it was Horace Hedd. Are you going to tell me that's wrong?"
"It may be. They have a different explanation on Earth."
"Oh?"
"They claim it's called that because it looks like a horse's head."
"What's a horse?"
"It's an animal on Earth."
"It's an amusing thought, but the Nebula doesn't look like any animal to me, Biron."
"It depends on the angle you look at it. Now from Nephelos it looks like a man's arm with three fingers, but I looked at it once from the observatory at the University of Earth. It does look a little like a horse's head. Maybe that is how the name started. Maybe there never was any Horace Hedd. Who knows?"
-- "The Stars, Like Dust", Isaac Asimov
Motivation
One day, while preparing for a walk at the beautiful Turkey Run State Park, we stopped by their small planetarium. In the room were number of excellent small space-themed exhibits, on loan from the Evansville Museum, a beautiful and varied museum which you should visit if you are anywhere near the southwestern corner of Indiana.
A particularly clever exhibit featured a a hand-pumped, see through vacuum chamber containing two stress relief dolls, one in a spacesuit, and one bare. In a few pumps, an observer could see the way the internal pressure of the object caused it to expand in a vacuum - in a dramatic way which delighted some local children out for a hike.
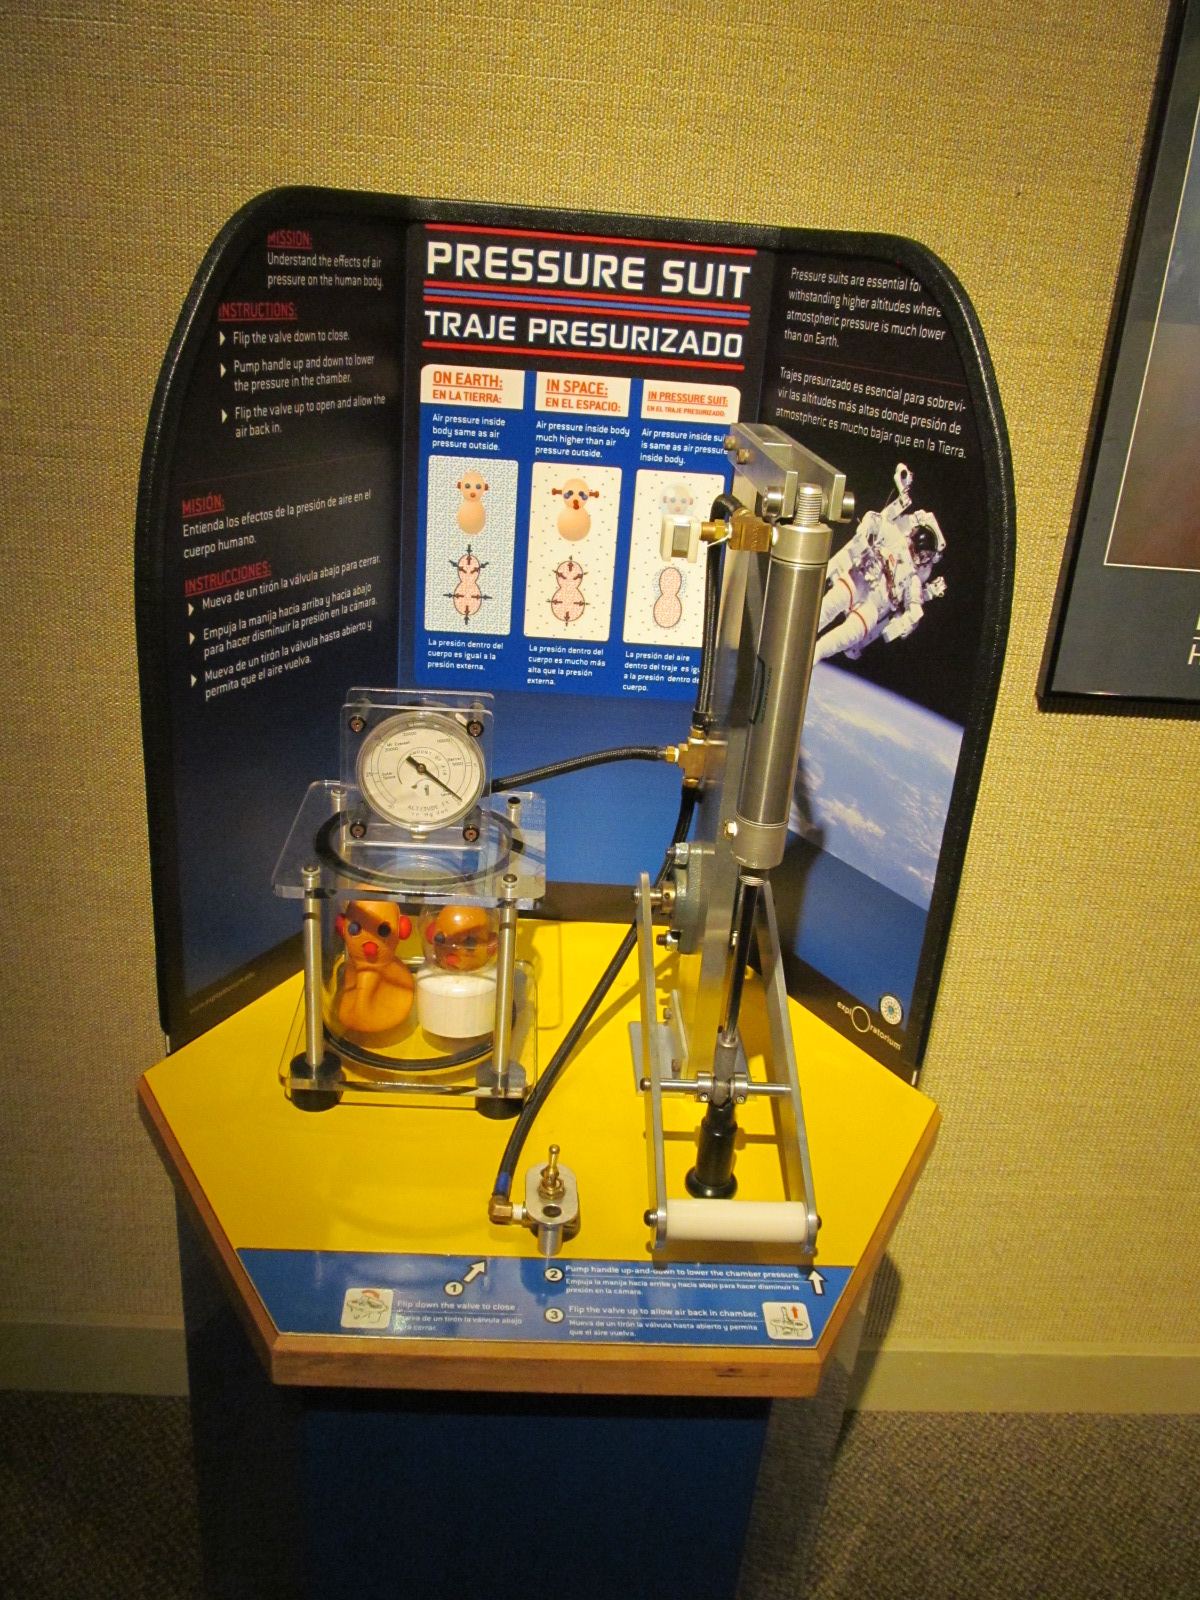
The entire collection of 11 portable exhibits, part of a national collaboration funded by the NSF in 2006 between 10 museums (8 in the midwest, one in Oregon, and one in Alaska), can be viewed with explanations in the manual shared by ScienceWorks supporting their copy of the exhibit.
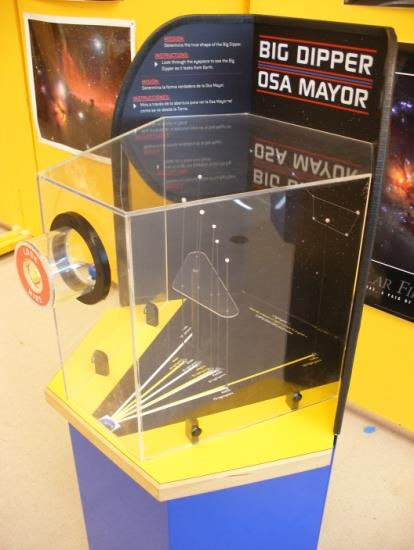
The exhibit that most affected me in this collection, however, was a collection of suspended white balls in a 3d box, against a black backdrop. They represented the big dipper asterism, and if you placed your eye at just the right spot, it was obvious - but from nearly any other angle, it was just a collection of stars.
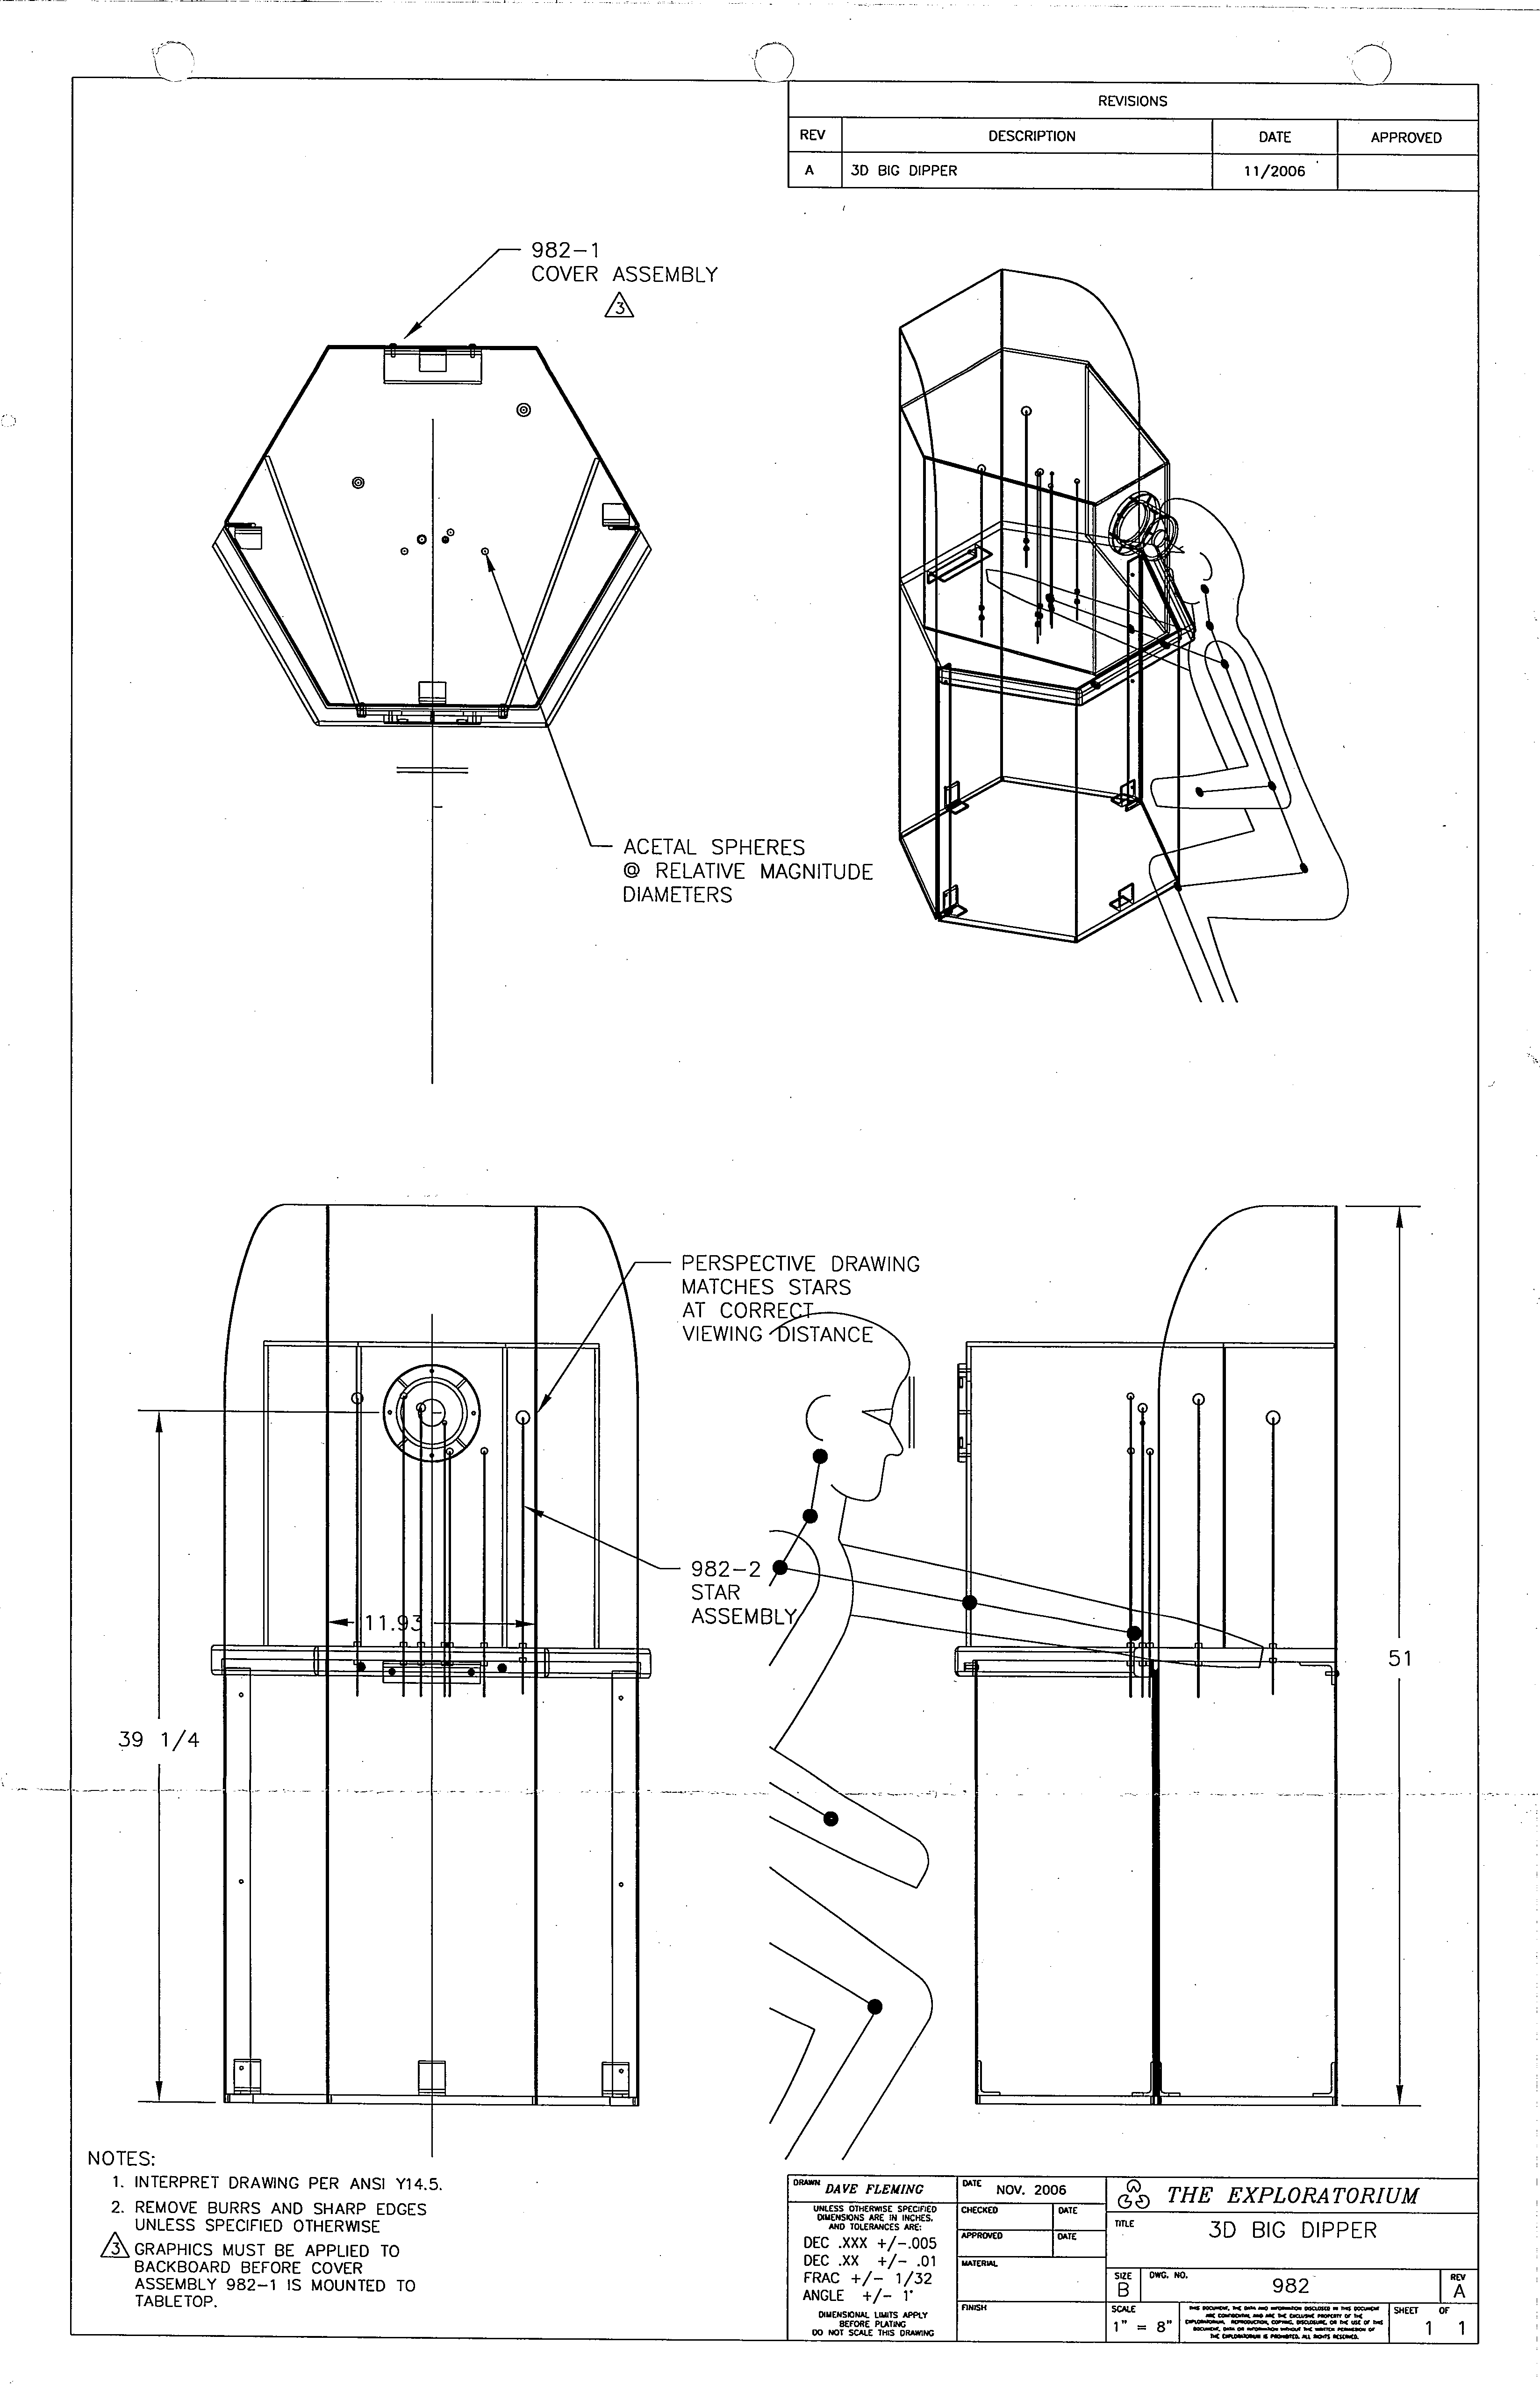
The Evansville Museum was kind enough to share some background and technical drawings of the exhibits, which are amusing and show detail on the precise operation of the device:
Like many great exhibits, this immediately connected to some memories. The quote at the introduction to this piece, which has stuck with me since I was a child, was first to mind. Second, the concept of orienting oneself in space by just the stars - practiced on some small scale by astronauts in the Apollo program through their onboard sextant eyepiece, and speculated as a way of locating oneself in the galaxy or universe more broadly.

If one could recognize the stars and three dimensional shape of the big dipper, then, one could use it as a sort of astronavigational compass in our corner of the Milky Way - knowing one's direction and distance from just these few stars would be enough to find one's position, relative to home. This is something I am sure to come back to, in some form, in interactive experiences in the future.
The next thought, and one that consumed an afternoon, was whether this kind of asterism-recognizing could be gamified. Orientation puzzles can be remarkably intuitive or mobile-friendly - for example, the game Zenbound has a calm energy and intuitive controls, no doubt the work of refinement on the part of its experienced developers, but tapping into something fundamental about the way humans interact with objects. Could recognizing or orienting the asterisms be interesting to me, and maybe others?
Project
In wanting this to be able to reach people easily, if it did end up being amusing or better, the language choice for the end product would likely be Javascript. This would also give me an opportunity to use a system introduced in HTML5 I had been excited to learn, but hadn't yet found a good use for - the Canvas element.
Most user interface tasks I have needed in the past could be handled easily in the traditional DOM or in animated SVG elements, both powerful and well-developed technologies, but accurate positioning of the stars would hopefully be easier in a more traditional graphics interface with more reliable absolute positioning, which advocates had promised Canvas could be.
Data
But that was getting ahead of myself. I needed, first, more precise locations for the stars, and groupings of them into asterisms. It turns out that accurate star data - public results of large collaborations around the world - is available from many sources and quite usable. Downloading samples of the Gaia catalog, and Yale catalog, I eventually chose the Hipparcos catalog. The differences in the readings and formats were of no consequence to a simple prototype project like this, and all the fields I needed were a star's position in space, and perhaps its luminosity and color. Gaia's dataset was larger than I needed, containing fainter stars than the human eye can see, and far more fields. Hipparcos had all the stars I would need for this project. The catalog file is read as bytes, and they are clearly labelled in a header file, easy enough to parse.
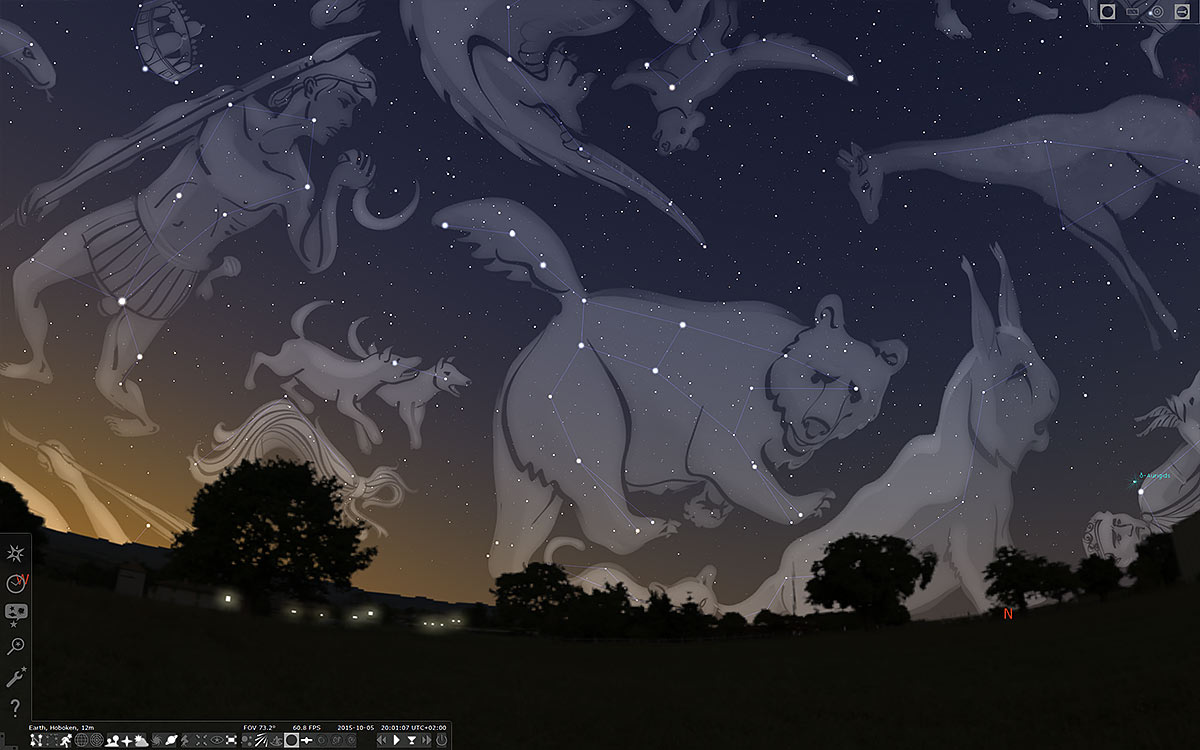
The astronomical definitions of the constellations - as blocked out regions of sky - are similarly available. But there are not so many good resources on the purely cultural phenomena of what are commonly called constellations - to astronomers, asterisms. However, there is a community of open source contributors, aided by cultural writers and consultants from around the world, who have done some impressive work on that front - the excellent screen/projector planetarium software Stellarium provides asterisms and lines, from many cultures, drawn between stars cataloged with enough information to match them to Hipparcos.
Parsing
Hipparcos provides data as values, largely numerical, delimited by the character|, in numerical order by Hipparcos number. Not containing any escape characters, it is easy to parse manually or with any CSV/TSV reader which allows for custom delimiters.
H|           1| |00 00 00.22|+01 05 20.4| 9.10| |H|000.00091185|+01.08901332| |   3.54|   -5.20|   -1.88|  1.32|  0.74|  1.39|  1.36|  0.81| 0.32|-0.07|-0.11|-0.24| 0.09|-0.01| 0.10|-0.01| 0.01| 0.34|  0| 0.74|     1| 9.643|0.020| 9.130|0.019| | 0.482|0.025|T|0.55|0.03|L| | 9.2043|0.0020|0.017|87| | 9.17| 9.24|       | | | |          | |  |1| | | |  |   |       |     |     |    |S| | |224700|B+00 5077 |          |          |0.66|F5          |S
H|           2| |00 00 00.91|-19 29 55.8| 9.27| |G|000.00379737|-19.49883745|+|  21.90|  181.21|   -0.93|  1.28|  0.70|  3.10|  1.74|  0.92| 0.12|-0.14|-0.24|-0.29| 0.01| 0.21|-0.02|-0.19|-0.28| 0.14|  2| 1.45|     2|10.519|0.033| 9.378|0.021| | 0.999|0.002|G|1.04|0.00|I| | 9.4017|0.0017|0.015|120| | 9.37| 9.44|       |C| | |          | |  |1|O| | |  |   |       |     |     |    | | | |224690|B-20 6688 |          |          |1.04|K3V         |4
H|           3| |00 00 01.20|+38 51 33.4| 6.61| |G|000.00500795|+38.85928608| |   2.81|    5.24|   -2.91|  0.53|  0.40|  0.63|  0.57|  0.47| 0.06| 0.09| 0.04| 0.43|-0.01|-0.06| 0.03| 0.24| 0.07| 0.21|  0|-0.45|     3| 6.576|0.004| 6.621|0.005| |-0.019|0.004|G|0.00|0.00|H| | 6.6081|0.0007|0.008|127| | 6.60| 6.62|       |C| | |00000+3852|I| 1|1| | | |  |   |       |     |     |    |S| | |224699|B+38 5108 |          |          |0.00|B9          |S
H|           4| |00 00 02.01|-51 53 36.8| 8.06| |H|000.00838170|-51.89354612| |   7.75|   62.85|    0.16|  0.53|  0.59|  0.97|  0.65|  0.65|-0.22|-0.09|-0.03| 0.24| 0.20| 0.08| 0.18| 0.08|-0.31|-0.18|  0|-1.46|     4| 8.471|0.007| 8.092|0.007| | 0.370|0.009|T|0.43|0.01|L| | 8.1498|0.0011|0.015|201| | 8.12| 8.18|       | | | |          | |  |1| | | |  |   |       |     |     |    |S| | |224707|          |          |P-52 12237|0.43|F0V         |2
H|           5| |00 00 02.39|-40 35 28.4| 8.55| |H|000.00996534|-40.59122440| |   2.87|    2.53|    9.07|  0.64|  0.61|  1.11|  0.67|  0.74| 0.10| 0.24| 0.06| 0.26|-0.10| 0.20|-0.16|-0.30|-0.19| 0.06|  0|-1.24|     5| 9.693|0.014| 8.656|0.010| | 0.902|0.013|T|0.90|0.01|L| | 8.7077|0.0018|0.019|161| | 8.68| 8.74|       | | | |          | |  |1| | | |  |   |       |     |     |    | | | |224705|          |C-41 15372|P-41  9991|0.95|G8III       |2
...
The headers are stored separately, and identify the fields numerically. From the header file, the fields of use in this project are:
H1          HIP        HIP_Number         /Identifier (HIP number)
H5          Vmag       Vmag               /Magnitude in Johnson V
H8          RAdeg      RA_Deg             /RA in degrees (ICRS, Epoch-J1991.25)
H9          DEdeg      Dec_Deg            /Dec in degrees (ICRS, Epoch-J1991.25)
H11         Plx        Parallax           /Trigonometric parallax
H37         B-V        BV_Color           /Johnson BV colour
This information is relative positioning to earth as it orbits the sun. What I need for this project is their relative positions in some cartesian estimate of their position, but this is possible - discounting the real but largely irrelevant issues of our universe not being cartesian - with some simple trigonometric calculations based on these numbers:
This places the stars, when we need to, into a floating-point reference frame centered on the earth in AU. We can convert from this later when assembling asterisms, with plenty of precision for this project.
All I need, then, is to link the asterism data from Stellarium to the Hipparcos number, and I can pick out the lines for parsing.
Stellarium is open source, largely GPLv2 licensed (though several graphical and data contributions are under other licenses), and the star data is available in the cultures section. For a small exploratory project, I have not spent much time chasing licenses and validating the data, but that is worth remembering for the future. For this prototype, we will use:
Localized asterism names in English are given in asterism_names.eng.fab:
...
# Associative and sectional asterisms
BDr _("Big Dipper (Plough)","asterism")
LDr _("Little Dipper","asterism")
SSR _("Seven Stars Row","asterism")
...
And the constellation lines are given in asterism_lines.fab:
...
# Associative and sectional asterisms
BDr 1 7  67301 65378 65378 62956 62956 59774 59774 54061 54061 53910 53910 58001 58001 59774
LDr 1 7  11767 85822 85822 82080 82080 77055 77055 79822 79822 75097 75097 72607 72607 77055
SSR 1 6  15863 9640 9640 5447 5447 3092 3092 677 677 113881 113881 112158
...
Looking over this data, these numbers were immediately familiar - they are already Hipparcos numbers. Noting the repeated numbers, and working off of the dippers (two very familiar asterisms), this data is given as pairs of Hipparcos numbers, each representing one line of an asterism. For example, the line from Polaris (HIP11767) to Yildun (HIP85822) is first in the Little Dipper, followed by the line from Yildun to the next light (actually a binary star system, collectively called ε Ursae Minoris, HIP85822).
Code
We can use some Python to read in the HIP headers and data:
from math import sin, cos, radians, sqrt
from statistics import mean
from json import dumps as jsondumps
from itertools import combinations
from csv import DictReader
import re


with open("hip_headers.dat") as f:
    f.readline()
    headers = ["Catalog"]+[l.split()[2] for l in f]
with open("hip_main.dat") as f:
    hip_data = [i for i in DictReader(f, headers, delimiter="|")]
hip_data = [{a.strip(): b.strip() for a, b in datum.items()}
            for datum in hip_data]
hip_data = [{a: (int(b) if b.isdigit() else b) for a, b in datum.items()}
            for datum in hip_data]
And, armed with that data and the above transformations, take the star lists from Stellarium to x,y,z coordinates, with a center point, which we can project, rotate about their center, and render without much difficulty:
def jsonify_asterism(line_list, target_width=400):
    stars = [i for i in hip_data if i["HIP_Number"] in line_list]
    stars.sort(key=lambda x: line_list.index(x["HIP_Number"]))
    hip_matching = {i["HIP_Number"]: n for n, i in enumerate(stars)}

    star_xyzs = []
    for star in stars:
        RA = radians(float(star["RA_Deg"]))
        Dec = radians(float(star["Dec_Deg"]))
        Dist = 1000/float(star['Parallax'])
        x = -cos(RA)*cos(Dec)*Dist
        y = sin(RA)*cos(Dec)*Dist
        z = sin(Dec)*Dist
        star_xyzs.append((x, y, z))

    max_width = .1
    center = star_xyzs[0]
    for a, b in combinations(star_xyzs, 2):
        gap = sqrt(sum((i-j)**2 for i, j in zip(a, b)))
        if gap > max_width:
            max_width = gap
            center = [(i+j)/2 for i, j in zip(a, b)]

    scale_factor = target_width/max_width
    scaled_xyz = [[round((b-a)*scale_factor, 2)
                   for a, b in zip(center, j)]
                  for j in star_xyzs]
    star_line_nums = [hip_matching[i] for i in line_list]
    star_lines = list(zip(star_line_nums[::2], star_line_nums[1::2]))

    star_data = {
        "stars": [{"x": x, "y": y, "z": z} for x, y, z in scaled_xyz],
        "lines": star_lines,
        "diameter": max_width
    }

    return star_data
giving a more manageable output:
"BDr": {
  "stars": [
    {
      "x": 65.49,
      "y": -204.67,
      "z": -71.76
    },
    {
      "x": -52.77,
      "y": -107.85,
      "z": -159.95
    },
    {
      "x": -37.71,
      "y": -68.7,
      "z": -137.9
    },
    {
      "x": -36.54,
      "y": -14.6,
      "z": -128.93
    },
    {
      "x": 52.77,
      "y": 107.85,
      "z": 159.95
    },
    {
      "x": -48.32,
      "y": 85.18,
      "z": -144.53
    },
    {
      "x": 1.15,
      "y": 16.1,
      "z": -135.42
    }
  ],
  "lines": [
    [
      0,
      1
    ],
    [
      1,
      2
    ],
    [
      2,
      3
    ],
    [
      3,
      4
    ],
    [
      4,
      5
    ],
    [
      5,
      6
    ],
    [
      6,
      3
    ]
  ],
  "diameter": 17.231129246420153,
  "name": "Big Dipper (Plough)"
},
Now, we can take this data and render it!
Implementation
I threw this together in a quick React component, using the Class model, which will allow us to easily keep a component state.
The component, at the Github repo, starts very simple:
class StarCanvas extends Component {
    render(){
    return (
      <div>
      </div>
      );
  }
}
}
Drawing Stars on the Canvas
Technically, this project is relatively simple. We can start with a canvas:
<canvas id="star-canvas" width="500" height="500">
</canvas>
A little star SVG:
<svg height="100" width="100" xmlns="http://www.w3.org/2000/svg" version="1.1">
  <polygon points="50,10 73,82 11,37 88,37 26,82" style="fill:none;stroke:black;stroke-width:5"/>
</svg>

The Canvas API provides a simple method context.drawImage for drawing images at locations:
drawStar(star){
  var size = (star.canvas.z)/this.canvas.width*20+20
  this.ctx.drawImage(this.starSVG,star.canvas.x-size/2,star.canvas.y-size/2,size,size);
}
and we can draw lines almost as easily:
drawLine(line){
  var p1 = this.state.star_data.stars[line[0]];
  var p2 = this.state.star_data.stars[line[1]];
  this.ctx.beginPath();
  this.ctx.strokeStyle = "#BBBBBB";
  this.ctx.moveTo(p1.canvas.x,p1.canvas.y)
  this.ctx.lineTo(p2.canvas.x,p2.canvas.y)
  this.ctx.closePath();
  this.ctx.stroke();
}
and group all the drawing into one function:
  drawCanvas(){
    this.ctx.clearRect(-this.canvas.width/2,-this.canvas.height/2,this.canvas.width, this.canvas.height);
    this.state.star_data.stars.forEach(this.updateStarData, this);
    if(this.state.show_lines){
        this.state.star_data.lines.forEach(this.drawLine,this);
    }
    if(this.state.show_stars){
      this.state.star_data.stars.forEach(this.drawStar,this);
    }
    this.rotations = {x:0,y:0};
    window.requestAnimationFrame(this.drawCanvas.bind(this));
  }
Rotating the Stars
Rotations are very familiar, and we can do them fairly quickly:
updateStarData(star){
  var [x,y,z] = [star.canvas.x, star.canvas.y, star.canvas.z];
  [x,z] = [Math.cos(this.rotations.x)*x + Math.sin(this.rotations.x)*z,
            -Math.sin(this.rotations.x)*x + Math.cos(this.rotations.x)*z];
  [y,z] = [Math.cos(this.rotations.y)*y + Math.sin(this.rotations.y)*z,
            -Math.sin(this.rotations.y)*y + Math.cos(this.rotations.y)*z];
  star.canvas.x = x;
  star.canvas.y = y;
  star.canvas.z = z;
}
All we need to do is capture the mouse input:
startMouseData(evt){
  if(evt.touches){
    evt = evt.touches[0];
  }
  this.startX = evt.clientX;
  this.startY = evt.clientY;
  this.mouseX = evt.clientX;
  this.mouseY = evt.clientY;
  this.moving = true;
}
moveMouse(evt){
  if(evt.touches){
    evt = evt.touches[0];
  }
  if(this.moving){
    this.rotations = {x:(evt.clientX - this.mouseX)/40,
                      y:(evt.clientY - this.mouseY)/40}
    this.mouseX = evt.clientX;
    this.mouseY = evt.clientY;
  }
}
endMouseData(evt){
    this.moving = false;
}
and bind all these listeners and objects via React's componentDidMount hook:
  componentDidMount(){
    this.canvas = document.getElementById("star-canvas");
    this.starSVG = document.getElementById("starsvg");
    this.ctx = this.canvas.getContext("2d");
    this.rotations = {x:0,y:0,z:0};
    this.ctx.translate(this.canvas.width/2,this.canvas.height/2);
    window.addEventListener("touchstart",this.startMouseData.bind(this));
    window.addEventListener("mousedown",this.startMouseData.bind(this));
    window.addEventListener("touchmove",this.moveMouse.bind(this));
    window.addEventListener("mousemove",this.moveMouse.bind(this));
    window.addEventListener("touchend",this.endMouseData.bind(this));
    window.addEventListener("mouseup",this.endMouseData.bind(this));
    window.requestAnimationFrame(this.drawCanvas.bind(this));
  }
As an avid touchscreen user, and especially in the time of the mobile/tablet-dominated web, it is important to bind for touch events as well. Fortunately the events can be handled largely the same.
We render the transformations as smoothly as the browser wishes with the requestAnimationFrame hook, the last key to our use of a Canvas.
Results
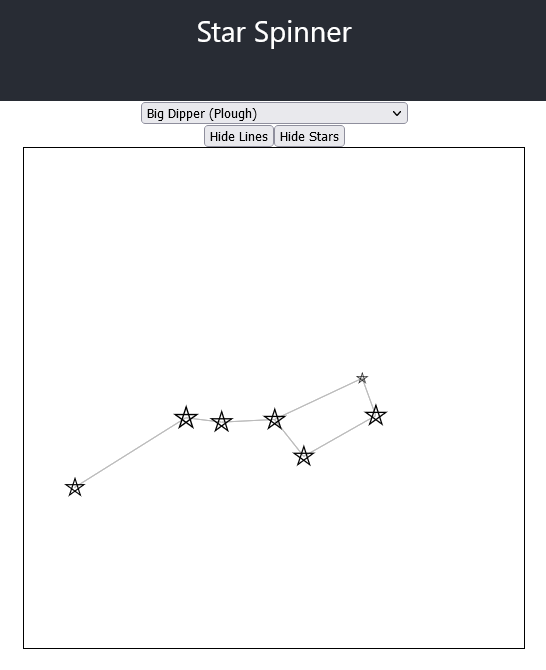
In the end, I got a workable example going, able to pivot and translate all of the asterisms in the data set. With it, you can replicate some of the experience from the exhibit:
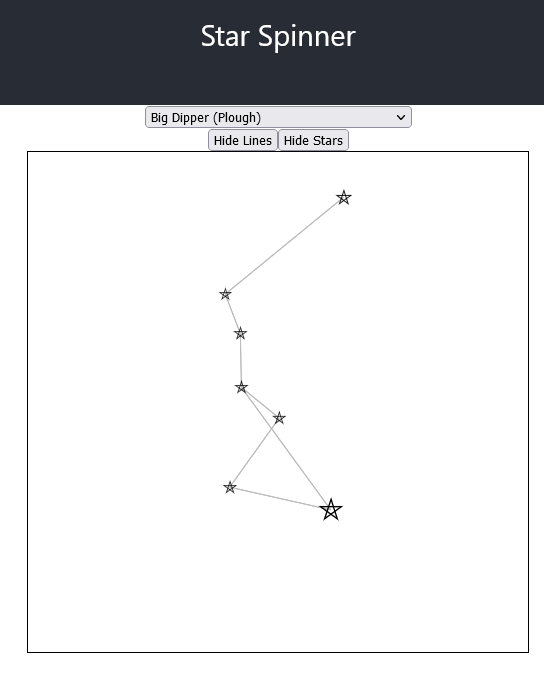
And spin the asterism around to see the big dipper:
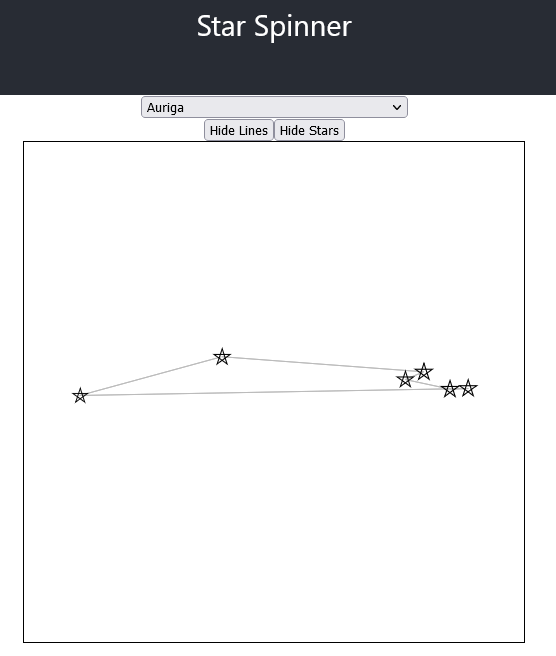
What I discovered, quickly, was that most asterisms represent stars very far away from each other in any other projection:
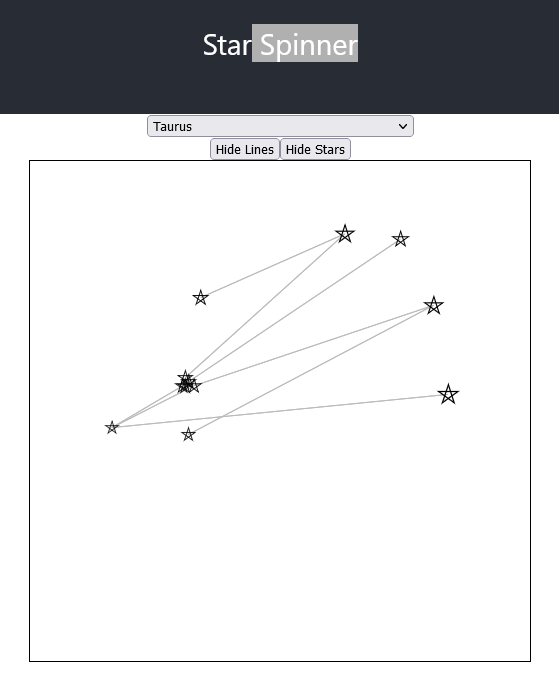
And very few are particularly interesting with this interface. But, it answered the question: what to asterisms look like from other angles? Mostly, like sticks:
Future Work
As the project ends up suggesting, while the results are interesting, they are not particularly fun except perhaps for the most invested person and for a handful of constellations. There are a few things that would be interesting to change, if I thought that I could make it worthwhile, but for now I feel I have all I am going to get out of it.
One could:
- Show confirmation of correct orientation, perhaps with the beautiful Asterism drawings by Johan Meuris created for Stellarium and released under the very permissive Free Art License.
- Adjust the size and color of the stars to better represent their real life equivalents, allowing for distinctive stars like Sirius to be more identifiable, or stars of relatively high brightness in their constellations like Polaris to pop more.
- Stellarium's asterisms use more stars than most folk asterisms I have found, at least for the ancient greek-derived asterisms. By selectively removing stars that are faint or unnecessary, I may be able to render more asterisms playable.
- Most asterisms fit into much narrower containers. With a more dynamic approach to keeping the stars on the canvas, we could zoom in on the stars more in close-to-correct views - allowing a much wider variety of asterisms to be played meaningfully.
- Show bright stars in the background which would be visible from the other angles - to get a better impression of what they would really look like from somewhere else.
- Expanding the canvas and interface.
- Add UI and explanations, for people who are stumbling onto it without my presence.
- Add some metrics to help find pain points and interface issues.
- Enhance the touch controls and 3d placement.
- Verifying licenses and sources for asterisms, and incorporating more asterisms from more world cultures.
- Expanding to other languages.
In the end, though, I am more excited by other related projects - such as finding a way to gamify the kind of multilateration one would need to place oneself in the galaxy or universe with nothing but a star catalog and a very good telescope.